Function Builder
An interactive function machine for patterns, numbers and equations.
Bar Charts
Practise constructing and interpreting bar charts for everyday situations.
Pictograms
Show that you can make sense of data displayed as pictograms and create some pictograms of your own.
Pie Charts
Develop the skills to construct and interpret pie charts in this self-marking set of exercises.
Gradient of a Line
Practise the skill of finding the gradients of straight lines by counting squares and dividing rise by run.
Plotting Graphs
Complete a table of values then plot the corresponding points to create a graph.
Histograms
Practise drawing and reading information from histograms displaying grouped data
Deconstructing Graphs
Fill in the tables of values from the information that can be read from the given graphs.
Straight Line Graph Equation
An online exercise about the equation y=mx+c and the features of a straight line graph.
Cartoon Scatter Graph
Place the cartoon characters on the scatter graph according to their height and age.
Graphs of Vertical and Horizontal Lines
Questions about the equations of straight line graphs that are parallel to the axes.
Estimating Correlation
Practise the skill of estimating the correlation of data on a scatter graph in this self marking exercise.
Correlation
Arrange the given statements in groups to show the type of correlation they have.
Don's Graph Snaps
Complete the tables and find the equations of the graphs that can be seen in the snaps.
Fill Graph Pairs
If the container is gradually filled with a steady flow of water which height-time graph would be produced?
Reading Graphs and Charts
Answer real-life problems from different types of graphs and charts including piece-wise linear graphs.
Completing the Square
Practise this technique for solving quadratic equations and analysing graphs.
Graph Equation Pairs
Match the equation with its graph. Includes quadratics, cubics, reciprocals, exponential and the sine function.
Linear Programming
A selection of linear programming questions with an interactive graph plotting tool.
Travel Graphs
Test your understanding of distance time graphs and speed time graphs (velocity time graph) with this self-marking exercise.
Graph Patterns
Find the equations which will produce the given patterns of graphs.
Comparing Graphs
Would you recognise a misleading graph if you saw one? Try this comparative judgement exercise to rate statistical graphs.
Graph Match
Match the equations with the images of the corresponding graphs. A drag-and-drop activity.
Name that Graph
Choose from the given functions the one that best describes the shape of the graph.
Graph Plotter
An online tool to draw, display and investigate graphs of many different kinds.
Using Graphs
Use the graphs provided and create your own to solve both simultaneous and quadratic equations.
Plotting Scatter Graphs
Plot scatter graphs from data representing a number of different everyday situations.
Parallel Graphs
Collect together in groups the equations of the graphs that are parallel to each other.
Perpendicular Pairs
Find the pairs of equations that will produce perpendicular graphs.
Yes No Questions
A game to determine the mathematical item by asking questions that can only be answered yes or no.
Equation of a Line Through Points
Match the equations of the straight line graphs to the clues about gradients and points.
Circle Equations
Recognise and use the equation of a circle with centre at the origin and the equation of a tangent to a circle.
Domain, Range and Asymptotes
Match the functions with their features. A drag and drop activity.
Differentiation
Practise the technique of differentiating polynomials with this self marking exercise.
Coordinate Geometry Table
Fill in the empty cells of this table with information about lines, gradients and coordinates.
Integration
Exercises on indefinite and definite integration of basic algebraic and trigonometric functions.
Transformations of Trig Graphs
Adjust the variables to match the animated graphs of the circular (trigonometric) functions.
Function Builder
An interactive function machine for patterns, numbers and equations.
Graph Plotter
An online tool to draw, display and investigate graphs of many different kinds.
Search for Infinity
Manipulate the Lissajou curve to produce a perfectly symmetrical (vertically and horizontally) infinity symbol.
This is the main Transum help video on Graphs.
Straight Line Graphs Video
After drawing a straight line graph learn about its equation in the form y = mx + c.
Scatter Graphs
Maths teachers from England construct a scatter graph from their heights and shoe sizes.
Travel Graphs Video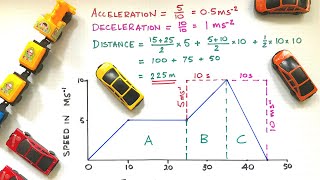
Learn about distance-time graphs, speed-time graphs and how to interpret them.
Human Graph Shapes Video
Chapel Hill-Chauncy Hall teacher Kelly Overbye demonstrates how she uses Multiple Intelligences, to teach her students about the slope of graphs. [Similar to Transum's Human Graphs]
Equation of Line through Points Video
A short video showing how to find the equation of a line that passes through given points.
Log Tables
Logarithms and log tables - what Transum used before calculators! A Numberphile video.
A Show Of Hands
Produce a number of graphs and charts from a quick show of hands.
Pie Chart Creator
A quick and convenient tool for rapidly creating simple pie charts.
Graph Paper
Flexible graph paper which can be printed or projected onto a white board as an effective visual aid.
Cartoon Scatter Graph
Place the cartoon characters on the scatter graph according to their height and age.
Correlation
Arrange the given statements in groups to show the type of correlation they have.
Human Scatter Graphs
Pupils move to positions in the room according to their data relative to the walls as axes.
Helicopter View
An animated introduction to distance-time graphs. Arial photographs of vehicles moving along a road placed side to side form a graph. Don't miss the Animal Race!
Hurdles Race
An animated distance time graph to be viewed while a student interprets the graph and comments on the race that produced the graph.
Comparing Graphs
Would you recognise a misleading graph if you saw one? Try this comparative judgement exercise to rate statistical graphs.
Straight Line Graphs
10 straight line graph challenges for use with computer graph plotting software or a graphical display calculator.
Graph Plotter
An online tool to draw, display and investigate graphs of many different kinds.
Human Graphs
Students should be encouraged to stand up and make the shapes of the graphs with their arms.
Graphing Quadratics
Describe how changing the coefficients of a quadratic function changes the graph of the function
Transformations of Functions
A visual aid showing how various transformations affect the graph of a function.

Choc Bar Chart
Interpret data given in the form of a bar chart then create a new bar chart showing the given statistics.

Graph Picture
Plot the given coordinates then join them up to form a picture.

Pie Chart
An exercise in estimating what the sectors of a pie chart represent.
49 items are currently in this category.
Teachers might find the complete Graphs Topic List useful.
This topic includes algebraic and statistical graphs including bar charts, line graphs, scatter graphs and pie charts.
A graph is a diagram which represents a relationship between two or more sets of numbers or categories. The data items are shown as points positioned relative to axes indicating their values.
Pupils are typically first introduced to simple bar charts and learn to interpret their meaning and to draw their own. More sophisticated statistical graphs are introduced as the pupil's mathematical understanding develops.
Pupils also learn about coordinates as a pre-requisite for understanding algebraic graphs. They then progress to straight line graphs before learning to work with curves, gradients, intercepts, regions and, for older pupils, calculus.