
|
|
HistogramsPractise drawing and reading information from histograms displaying grouped data |
This is level 4: complete a frequency table with information from a histogram showing frequency density. You can earn a trophy if you get at least 4 questions correct and you do this activity online.
InstructionsTry your best to answer the questions above. Type your answers into the boxes provided leaving no spaces. As you work through the exercise regularly click the "check" button. If you have any wrong answers, do your best to do corrections but if there is anything you don't understand, please ask your teacher for help. When you have got all of the questions correct you may want to print out this page and paste it into your exercise book. If you keep your work in an ePortfolio you could take a screen shot of your answers and paste that into your Maths file. |
||
|
|
||
|
|

|
More Activities: |
|
Mathematicians are not the people who find Maths easy; they are the people who enjoy how mystifying, puzzling and hard it is. Are you a mathematician? Comment recorded on the 3 October 'Starter of the Day' page by Mrs Johnstone, 7Je: "I think this is a brilliant website as all the students enjoy doing the puzzles and it is a brilliant way to start a lesson." Comment recorded on the 28 May 'Starter of the Day' page by L Smith, Colwyn Bay: "An absolutely brilliant resource. Only recently been discovered but is used daily with all my classes. It is particularly useful when things can be saved for further use. Thank you!" |
Each month a newsletter is published containing details of the new additions to the Transum website and a new puzzle of the month. The newsletter is then duplicated as a podcast which is available on the major delivery networks. You can listen to the podcast while you are commuting, exercising or relaxing. Transum breaking news is available on Twitter @Transum and if that's not enough there is also a Transum Facebook page. |
|
Featured ActivityNewsletter The Transum Newsletter for August 2026 has just been published. Click on the image above to read about the latest developments on this site and try to solve the puzzle of the month. You can read the newsletter online or listen to it by downloading the podcast. |
AnswersThere are answers to this exercise but they are available in this space to teachers, tutors and parents who have logged in to their Transum subscription on this computer. A Transum subscription unlocks the answers to the online exercises, quizzes and puzzles. It also provides the teacher with access to quality external links on each of the Transum Topic pages and the facility to add to the collection themselves. Subscribers can manage class lists, lesson plans and assessment data in the Class Admin application and have access to reports of the Transum Trophies earned by class members. If you would like to enjoy ad-free access to the thousands of Transum resources, receive our monthly newsletter, unlock the printable worksheets and see our Maths Lesson Finishers then sign up for a subscription now: Subscribe |
|
Go MathsLearning and understanding Mathematics, at every level, requires learner engagement. Mathematics is not a spectator sport. Sometimes traditional teaching fails to actively involve students. One way to address the problem is through the use of interactive activities and this web site provides many of those. The Go Maths page is an alphabetical list of free activities designed for students in Secondary/High school. Maths MapAre you looking for something specific? An exercise to supplement the topic you are studying at school at the moment perhaps. Navigate using our Maths Map to find exercises, puzzles and Maths lesson starters grouped by topic. | ||
Teachers | ||
|
If you found this activity useful don't forget to record it in your scheme of work or learning management system. The short URL, ready to be copied and pasted, is as follows: |
Alternatively, if you use Google Classroom, all you have to do is click on the green icon below in order to add this activity to one of your classes. |
It may be worth remembering that if Transum.org should go offline for whatever reason, there is a mirror site at Transum.info that contains most of the resources that are available here on Transum.org. When planning to use technology in your lesson always have a plan B! |
|
Do you have any comments? It is always useful to receive feedback and helps make this free resource even more useful for those learning Mathematics anywhere in the world. Click here to enter your comments. |
||
© Transum Mathematics :: This activity can be found online at:
www.Transum.org/go/?Num=820
Close

Reading Graphs and Charts - Answer real-life problems from different types of graphs and charts including piece-wise linear graphs.
Level 1 - Show the height of one bar in an almost-complete histogram with fixed class intervals
Level 2 - Read information from histograms with fixed class intervals
Level 3 - Complete a frequency table with information from a histogram with unequal class intervals
Level 4 - Complete a frequency table with information from a histogram showing frequency density
Level 5 - General questions about histograms with varying class widths
Comparing Data - Which statements about the differences and similarities of two data sets, shown as histograms, are correct?
Exam Style Questions - A collection of problems in the style of GCSE or IB/A-level exam paper questions (worked solutions are available for Transum subscribers).
More on this topic including lesson Starters, visual aids, investigations and self-marking exercises.
Answers to this exercise are available lower down this page when you are logged in to your Transum account. If you don’t yet have a Transum subscription one can be very quickly set up if you are a teacher, tutor or parent.
See the National Curriculum page for links to related online activities and resources.
Histograms are similar to bar charts but there is one important difference. It is the area of the bars in a histogram that is proportional to the frequency rather than the height.
The first couple of levels of this exercise features histograms with equal class widths which means the heights of the bars can be conveniently used to find the frequency.
Levels 3 onwards contain histograms with unequal class widths so the vertical axis can be thought of as the frequency density.
Frequency = Frequency density × Class Width
Histograms can be used to represent both discrete and continuous data but they are typically used for displaying continuous data.
To draw a histogram, the data first needs to be assigned to a number of different groups (classes or bins). There are various theories concerning how many of these groups there should be but the normal is between five and twenty depending on the amount of data. A number of consecutive groups containing very little data may be merged into a single group.
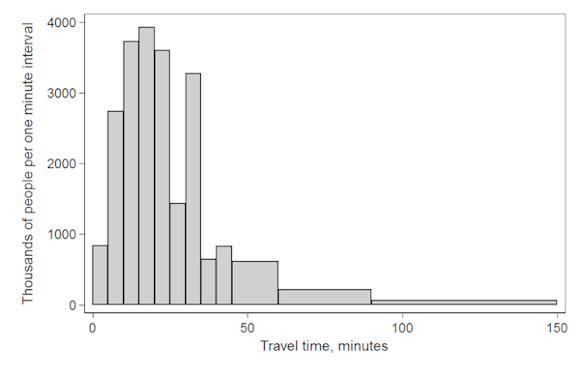
Qwfp at English Wikipedia [CC BY-SA 3.0], via Wikimedia Commons
Don't wait until you have finished the exercise before you click on the 'Check' button. Click it often as you work through the questions to see if you are answering them correctly. You can double-click the 'Check' button to make it float at the bottom of your screen.
Answers to this exercise are available lower down this page when you are logged in to your Transum account. If you don’t yet have a Transum subscription one can be very quickly set up if you are a teacher, tutor or parent.
Close


Ella Chandler, England
Saturday, December 11, 2021
"Level 1 and 2 of the 'Histogram' activity are incorrect, they show and ask questions about bar charts but refer to them as histograms when the y-axis is clearly labelled frequency, not frequency density. This is a shame as I find these activities very useful with my students and am sad to not have an activity I can with them for this topic.
[Transum: Thank you for your feedback Ella. The definitions of a histogram that I have read do not stipulate that the y-axis should represent frequency density unless the groups (bins) are not all the same width.]"