
|
|
Exam-Style Questions on HistogramsProblems on Histograms adapted from questions set in previous Mathematics exams. |
1. | IGCSE Extended [112] |
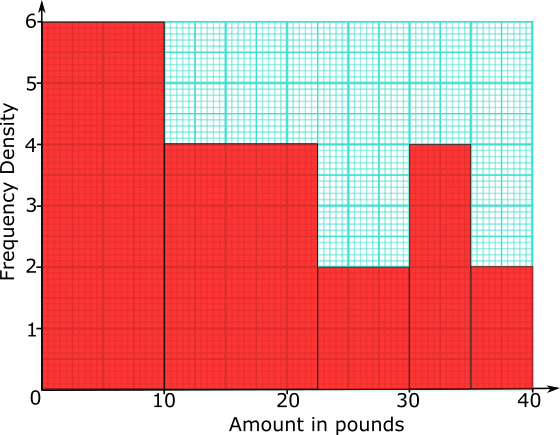
155 people were asked how much money they would pay for particular three-course meal in a special restaurant.
The histogram shows the results of the survey.
(a) Complete the frequency table for information shown in the histogram.
| Amount (£\(x\)) | \(0\lt x \le 10\) | ||||
|---|---|---|---|---|---|
| Frequency | 20 |
(b) Use your frequency table to calculate an estimate of the mean amount these people would pay for the meal.
2. | GCSE Higher [244] |
The table shows the amount of time, in months, taken to sell houses on the Happyland housing estate.
| Time (m months) | Frequency |
| 0 < m ≤ 2 | 10 |
| 2 < m ≤ 5 | 21 |
| 5 < m ≤ 10 | 25 |
| 10 < m ≤ 15 | 20 |
| 15 < m ≤ 20 | 25 |
(a) Draw a histogram for the information in the table.
(b) Find an estimate for the median.
3. | GCSE Higher [305] |
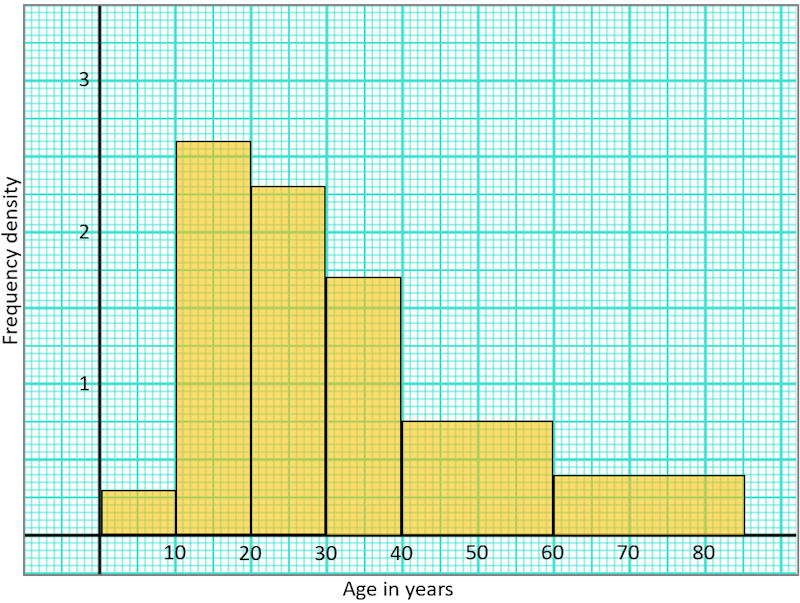
This histogram shows information about the ages of 317 people attending a charity concert. The cost of tickets for children under 15 years of age are half price. If a full price ticket was £18, estimate the total income of all 317 ticket sales.
4. | GCSE Higher [830] |
The heights of a sample of 174 Premier League footballers are recorded.
The table shows the results.
| Height (\(h\) cm) | \(164 < h \leq 174\) | \(174 < h \leq 178\) | \(178 < h \leq 184\) | \(184 < h \leq 194\) | \(194 < h \leq 206\) |
|---|---|---|---|---|---|
| Frequency | 10 | 32 | 54 | 60 | 18 |
(a) Calculate an estimate of the mean height.
(b) Two different footballers are chosen at random.
Find the probability that both footballers have a height greater than 184 cm and no more than 194 cm.
(c) Complete the histogram to show the information in the frequency table.
5. | GCSE Higher [672] |
The histogram gives information about the times 475 kittens took to get over an obstacle.
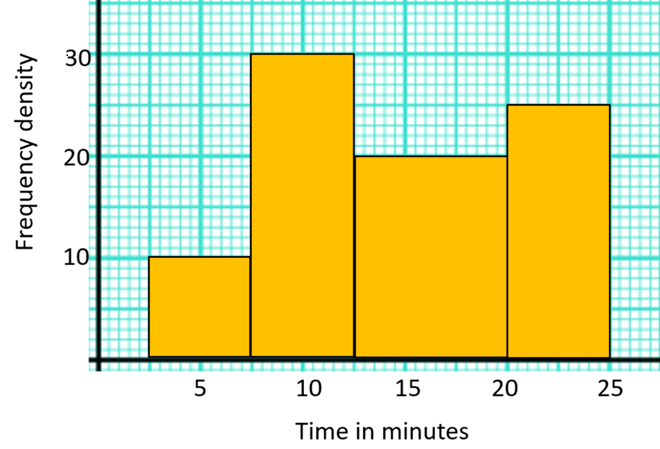
Calculate an estimate for the mean time.
6. | GCSE Higher [548] |
The histogram gives information about the distribution of the heights of some shrubs grown by a garden supplier.
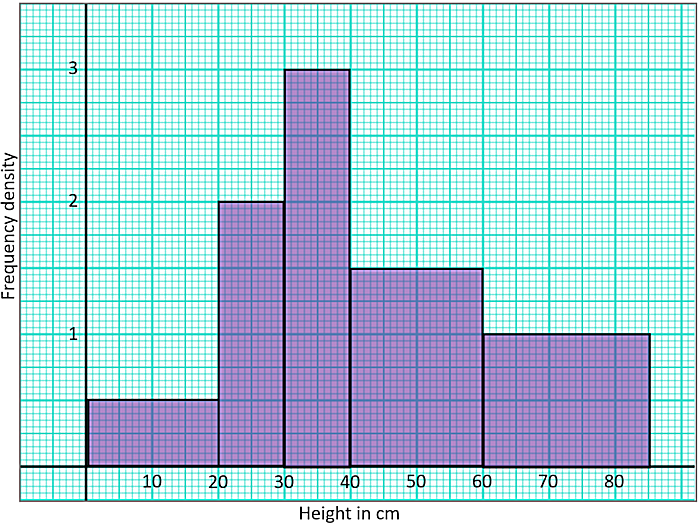
The shrubs are on sale at the following prices:
A pie chart is drawn using the information above to show the number of shrubs in each price category. Calculate, to the nearest degree, the angle in the sector representing shrubs sold for £12.
If you would like space on the right of the question to write out the solution try this Thinning Feature. It will collapse the text into the left half of your screen but large diagrams will remain unchanged.
The exam-style questions appearing on this site are based on those set in previous examinations (or sample assessment papers for future examinations) by the major examination boards. The wording, diagrams and figures used in these questions have been changed from the originals so that students can have fresh, relevant problem solving practice even if they have previously worked through the related exam paper.
The solutions to the questions on this website are only available to those who have a Transum Subscription.
Exam-Style Questions Main Page
To search the entire Transum website use the search box in the grey area below.
Do you have any comments about these exam-style questions? It is always useful to receive feedback and helps make this free resource even more useful for those learning Mathematics anywhere in the world. Click here to enter your comments.