Here are some examples that a teacher could show to a class and discuss:
For more graphs and charts try the Show of Hands facility or visit the main Data Handling page.
Suggested
Pie Charts

Develop the skills to construct and interpret pie charts in this self-marking set of exercises.
The short web address is:
Transum.org/go/?Num=233
Suggested
Tally Charts

Read and draw simple tally charts to record and count different types of data.
The short web address is:
Transum.org/go/?Num=1084
Suggested
Pictograms
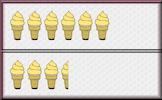
Show that you can make sense of data displayed as pictograms and create some pictograms of your own.
The short web address is:
Transum.org/go/?Num=96
Do you have any comments? It is always useful to receive feedback and helps make this free resource even more useful for those learning Mathematics anywhere in the world. Click here to enter your comments.


Simon Kuestenmacher, Twitter
Saturday, April 14, 2018
Unknown Source,
Sunday, July 7, 2019
"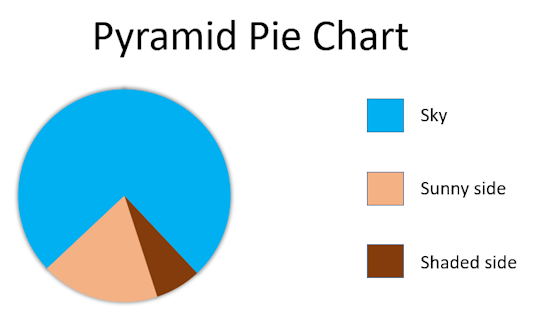 "
"
Eric Hittinger, Twitter
Thursday, March 20, 2025