List Reading
Practise reading numerical information from lists of different types.
Pin Drop
Estimate the probability of a drawing pin landing point up from experimental data.
Pie Charts
Develop the skills to construct and interpret pie charts in this self-marking set of exercises.
Histograms
Practise drawing and reading information from histograms displaying grouped data
Tally Charts
Read and draw simple tally charts to record and count different types of data.
Comparing Data
Compare two distributions using appropriate measures of central tendency and spread.
Comparing Graphs
Would you recognise a misleading graph if you saw one? Try this comparative judgement exercise to rate statistical graphs.
Reaction Time
When the numbers appear hit the correct button depending on whether the numbers are even or odd
Tally Charts Video
A guided tour through the levels of the Tally Charts online exercise.
Scatter Graphs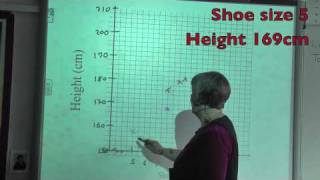
Maths teachers from England construct a scatter graph from their heights and shoe sizes.
Visualising Data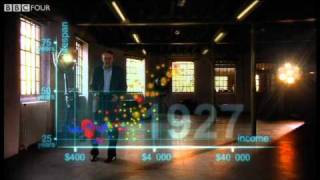
Hans Rosling's famous lectures combine enormous quantities of public data with a sport's commentator's style to reveal the story of the world's past, present and future development.
A Show Of Hands
Produce a number of graphs and charts from a quick show of hands.
Pie Chart Creator
A quick and convenient tool for rapidly creating simple pie charts.
Human Scatter Graphs
Pupils move to positions in the room according to their data relative to the walls as axes.
Comparing Graphs
Would you recognise a misleading graph if you saw one? Try this comparative judgement exercise to rate statistical graphs.
t-Test Revision
A slide presentation designed to revise the key aspects of Student's t-Test.

Average Smile
Calculate the mean, median and range of the given scores.

Pick From The Pot
The pot contains 10 counters which are being randomly removed and replaced. How many of each colour do you think are in the pot?

Pie Chart
An exercise in estimating what the sectors of a pie chart represent.

Tran's Hats
In how many different ways might Tran decide to wear his hats in one week?

Weather Maths
Eight mathematical questions about the current weather and times in four cities around the world.
16 items are currently in this category.
Teachers might find the complete Data Handling Topic List useful.
Data is talked about more this decade than ever before. Whether it be how social media companies deal with your personal data or how analysing data can improve algorithms for systems that make everyday life easier or more profitable.
Pupils are first introduced to small, familiar data sets and learn to visualise them in many different ways. They may produce their own data from experiments, observations or games and will then describe their data in different ways.
Pupils will calculate averages and other summary measures (mean, median, mode range) and produce bar charts, pie charts and box plots.
Older pupils will use technology to help analyse larger data sets and will be introduced to inter-quartile range and standard deviation. They will draw conclusions from scatter diagrams, and have a basic understanding of correlation. They will learn how to apply statistical information to calculate probabilities.
See also the topics called Statistics, Averages and Probability.