
|
|
Exam-Style Questions.Problems adapted from questions set for previous Mathematics exams. |
1. | GCSE Higher [258] |
Ben measured the length and the width of each of 10 sea shells of the same type. The results are shown below.
(a) Construct a scatter graph with this data.
| Sea Shell Dimensions | |
| Length(cm) | Width(cm) |
| 7.3 | 2.7 |
| 9.7 | 3.2 |
| 7.5 | 2.6 |
| 6.1 | 2.9 |
| 9.0 | 2.9 |
| 8.7 | 3.0 |
| 7.5 | 2.5 |
| 10.3 | 3.5 |
| 9.5 | 3.3 |
The point representing the results for one of the shells is an outlier.
(b) Explain how the results for this shell differ from the results for the other shells.
2. | GCSE Higher [262] |
The number of visitors to a cycle track and the number of drinks sold by a café at the location are recorded in the table below.
| Monday | Tuesday | Wednesday | Thursday | Friday | Saturday | Sunday | |
| Numver of visitors | 32 | 45 | 39 | 43 | 58 | 84 | 65 |
| Drinks sold | 17 | 20 | 23 | 7 | 24 | 49 | 38 |
The data is shown in the following scatter diagram:
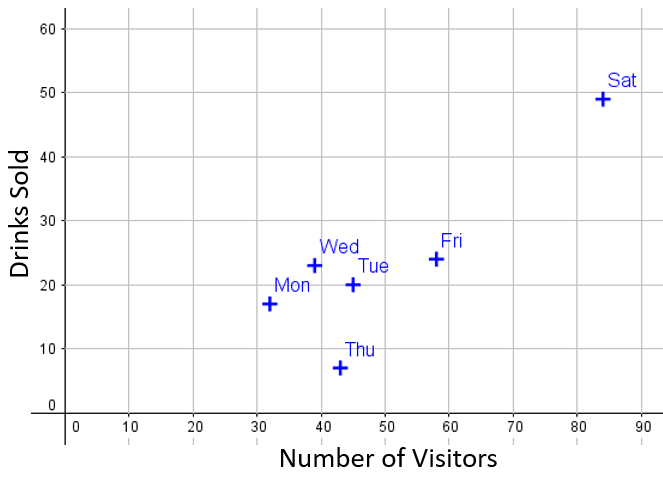
(a) Add Sunday's data to the scatter diagram.
(b) Draw, by eye, a line of best fit on the scatter diagram.
(c) Describe the relationship between the number of visitors and the number of drinks sold.
(d) Which particular day does not fit the relationship?
(e) If one day there were 50 visitors, estimate how many drinks would be sold.
3. | GCSE Higher [339] |
The scatter graph shows the maximum temperature (oC) and the number of bowls of soup sold at a sandwich shop on twelve randomly selected days last year.
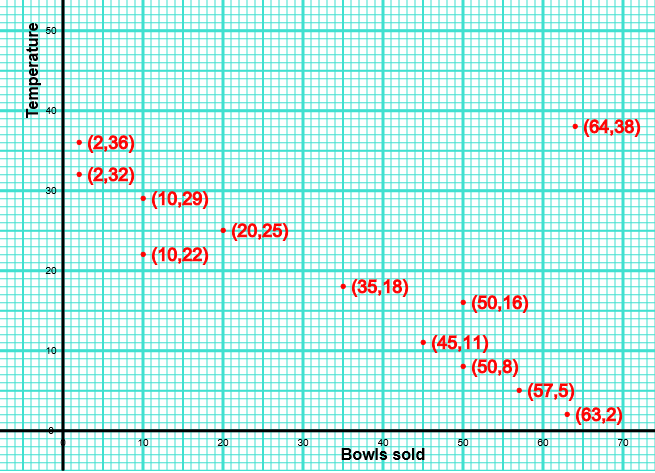
(a) One of the points is an outlier. What temperature does this outlier represent.
(b) For all the other points write down the type of correlation.
(c) On another day of the year, the temperature was 20oC. Estimate the number of bowls of soup sold on that day.
(d) The shop owner says "We sell more bowls of soup the higher the temperature". Does the scatter graph support this statement? Give a reason for your answer.
4. | GCSE Higher [689] |
In the Bubbleless Bandits free-diving club, members practice breath-holding techniques as part of their routine.

In this club, the older members have been practicing these techniques for many years, leading to increased breath-holding capacity through disciplined training and improved technique. The older members tend to be the more experienced free-divers. They have mastered relaxation and breath control, contributing to their ability to hold their breath for longer periods.
The times, \( t \) seconds, that club members could hold their breath while diving and their ages, \( x \) years, are recorded. The results are shown in the table.
| Age, \( x \) years | Time, \( t \) seconds |
|---|---|
| 19 | 37 |
| 31 | 44 |
| 55 | 101 |
| 33 | 63 |
| 29 | 55 |
| 61 | 110 |
| 40 | 78 |
| 35 | 71 |
(a) Draw a scatter diagram to represent this data.
(b) What type of correlation is shown on the scatter diagram?
(c) Find the equation of the regression line giving your answer in the form \( t = ax + b \).
(d) Use your regression equation to estimate the time a person aged 45 could hold their breath.
(e) Give a reason why you should not use the regression equation to estimate the time it would take a person aged 14 to do the task.
5. | GCSE Higher [135] |
The scatter graph gives information about the marks earned in a Statistic exam and a Mathematics exam by each of 13 students.
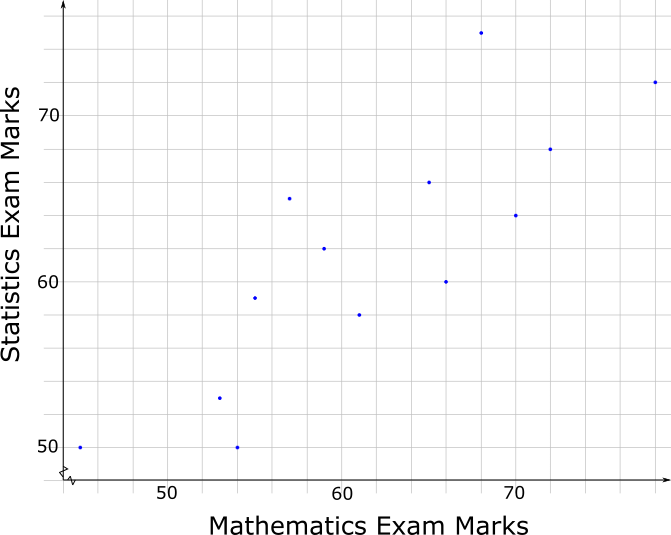
The box plot for the Mathematics exam for the 13 students is drawn on the grid below.
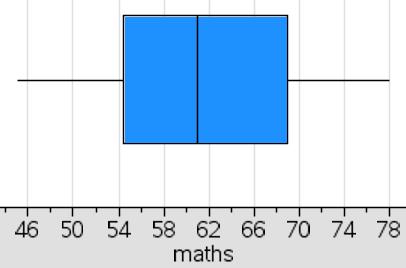
(a) Draw the box plot for the Statistics exam.
(b) Compare the distributions of marks scored in the two exams.
6. | IB Analysis and Approaches [757] |
Ten students are given a test on calculus and a test on probability. Each test is scored out of a total of 100 marks. The scores of the students are shown in the following table:

| Student | 1 | 2 | 3 | 4 | 5 | 6 | 7 | 8 | 9 | 10 |
|---|---|---|---|---|---|---|---|---|---|---|
| Calculus | 50 | 68 | 98 | 90 | 79 | 78 | 85 | 99 | 69 | 59 |
| Probability | 56 | 74 | 96 | 90 | 81 | 80 | 87 | 98 | 74 | 66 |
Let \( x \) be the score on the calculus test and \( y \) be the score on the probability test.
The teacher finds that the equation of the regression line of \( y \) on \( x \) for these scores is
$$ y = 0.815x + 17.1 $$
(a) Find the value of Pearson’s product-moment correlation coefficient, \( r \).
Jaidee was absent for the calculus test and Permsak was absent for the probability test.
The teacher uses the regression line of \( y \) on \( x \) to estimate the missing scores.
Permsak scored 15 on the calculus test.
The teacher estimated his score on the probability test to be 29 to the nearest integer using the following calculation:
$$ y = 0.815(15) + 17.1 \approx 29 $$
(b) Give a reason why this method is not appropriate for Permsak.
Jaidee scored 85 on the probability test.
(c) Use an appropriate method to show that the estimated calculus test score for Jaidee is 83 to the nearest integer.
7. | IB Studies [12] |
In a survey of insect life near a stream, a student collected data about the number of different insect species \((y)\) that were found at different distances \((x)\) in metres from the stream.
| Distance \((x)\) | 2 | 5 | 8 | 11 | 14 | 17 | 22 | 33 | 39 |
|---|---|---|---|---|---|---|---|---|---|
| Insect species \((y)\) | 26 | 25 | 19 | 19 | 14 | 9 | 5 | 3 | 2 |
(a) Draw a scatter diagram to show the data.
(b) Using your scatter diagram, describe the correlation between the number of different insect species and the distance from the stream.
(c) Find \(\bar x\), the mean of the distances from the stream;
(d) Find \(\bar y\), the mean number of insect species.
(e) Plot the point \((\bar x,\bar y)\) on your scatter diagram. Label this point M.
(f) Write down the equation of the regression line \(y\) on \(x\) for the above data.
(g) Draw the regression line \(y\) on \(x\) on your scatter diagram.
(h) Estimate the number of insect species to be found 30 metres from the stream.
8. | IB Studies [23] |
The table below shows the scores for 12 students on two Mathematic exam papers. For the first paper calculators were allowed and for the second paper they were not.
| Paper 1 (\(x\)) | 74 | 73 | 65 | 75 | 68 | 72 | 69 | 71 | 83 | 68 | 68 | 73 |
|---|---|---|---|---|---|---|---|---|---|---|---|---|
| Paper 2 (\(y\)) | 75 | 83 | 69 | 77 | 71 | 77 | 68 | 76 | 84 | 69 | 71 | 75 |
(a) Write down the mean score on Paper 1.
(b) Write down the standard deviation of the scores for Paper 1.
(c) Find the number of students that had a score of more than one standard deviation below the mean on Paper 1.
(d) Write down the correlation coefficient, \(r\).
(e) Write down the equation of the regression line of \(y\) on \(x\).
Another student scored 75 on Paper 1.
(f) Calculate an estimate of his score on Paper 2
Another student scored 88 on Paper 1.
(g) Determine whether you can use the equation of the regression line to estimate his score on Paper 2. Give a reason for your answer.
If you would like space on the right of the question to write out the solution try this Thinning Feature. It will collapse the text into the left half of your screen but large diagrams will remain unchanged.
The exam-style questions appearing on this site are based on those set in previous examinations (or sample assessment papers for future examinations) by the major examination boards. The wording, diagrams and figures used in these questions have been changed from the originals so that students can have fresh, relevant problem solving practice even if they have previously worked through the related exam paper.
The solutions to the questions on this website are only available to those who have a Transum Subscription.
Exam-Style Questions Main Page
To search the entire Transum website use the search box in the grey area below.
Do you have any comments about these exam-style questions? It is always useful to receive feedback and helps make this free resource even more useful for those learning Mathematics anywhere in the world. Click here to enter your comments.

