Statistics Starters:
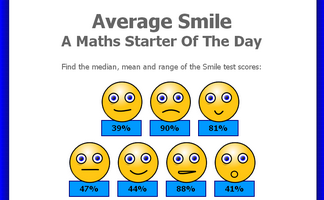
Calculate the mean, median and range of the given scores.
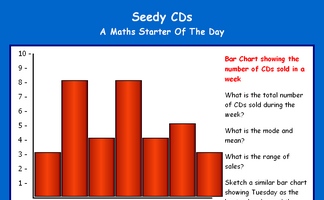
Interpret data given in the form of a bar chart then create a new bar chart showing the given statistics.
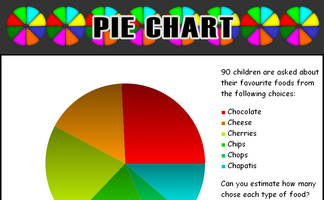
An exercise in estimating what the sectors of a pie chart represent.
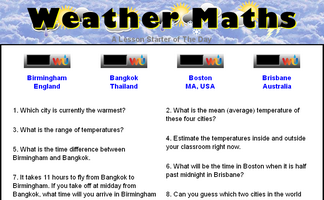
Eight mathematical questions about the current weather and times in four cities around the world.
Exercises

A Show Of Hands
Produce a number of graphs and charts from a quick show of hands.
Averages
Test your understanding of averages with this self marking quiz about mean, median and range.
Bar Charts
Practise constructing and interpreting bar charts for everyday situations.
Box Plots
An exercise on reading and drawing box-and-whisker diagrams which represent statistical data.
Centre and Variability
Make sense of and determine the reasonableness of the mean and median of a data set by looking at the values.
Choose Your Average
This is a game for two players. You should know how to find the mean, median and range of a set of numbers.
Code Cracker
Crack the code by replacing the encrypted letters in the given text. There are lots of hints provided about code breaking techniques.
Code Cracking Presentation
A slide presentation showing techniques for cracking simple codes and ciphers.
Comparing Data
Compare two distributions using appropriate measures of central tendency and spread.
Comparing Graphs
Would you recognise a misleading graph if you saw one? Try this comparative judgement exercise to rate statistical graphs.
Correlation
Arrange the given statements in groups to show the type of correlation they have.
Cumulative Frequency
Online exercises on cumulative frequency for discrete and grouped data with exam-style questions.
Estimating Correlation
Practise the skill of estimating the correlation of data on a scatter graph in this self marking exercise.
Histograms
Practise drawing and reading information from histograms displaying grouped data

Human Scatter Graphs
Pupils move to positions in the room according to their data relative to the walls as axes.
List Reading
Practise reading numerical information from lists of different types.
Mixed Medians
Find the medians of sets of different types of numbers in these self-marking exercises.
Normal Distribution Calculator
A customised online calculator for quickly finding areas under the normal distribution curve.
Odd Scatter Out
Just by looking at the scatter graphs can you decide which is the odd one out according to their summary statistics?
Pictograms
Show that you can make sense of data displayed as pictograms and create some pictograms of your own.

Pie Chart Creator
A quick and convenient tool for rapidly creating simple pie charts.
Pie Charts
Develop the skills to construct and interpret pie charts in this self-marking set of exercises.
Pin Drop
Estimate the probability of a drawing pin landing point up from experimental data.
Plinko Probability
A simulation of a Quincunx (Galton Board) which can be used to create the bell shaped curve of the normal distribution.
Plotting Scatter Graphs
Plot scatter graphs from data representing a number of different everyday situations.
Quartiles
Practise processing the sets of numbers to find the lower and upper quartiles.
Reading Graphs and Charts
Answer real-life problems from different types of graphs and charts including piece-wise linear graphs.
Significance
A slide presentation showing how to use the chi-squared test to measure significance.
Standard Deviation
Find how 'spread out' data is by estimating and calculating this measure of dispersion.
StatGrid Challenge
Arrange the numbers one to nine in a three by three grid to obtain the given means, medians and ranges.
Statistics Supplied
Find all of the sets of numbers matching the given statistical conditions.
Stem and Leaf Diagrams
Practise your ability to read and construct stem-and-leaf diagrams for statistical data.
t-Test Revision
A slide presentation designed to revise the key aspects of Student's t-Test.
Tally Charts
Read and draw simple tally charts to record and count different types of data.
Other activities for this topic | | |
Complete Index of Starters