Point at the grid
Transum · Shine+Write · Visual aid

Graph Paper
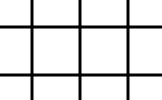
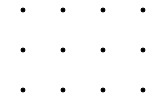
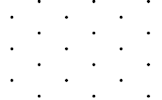
Customise the graph paper - then save, print or copy and paste.
Customise the graph paper - then save, print or copy and paste.
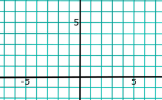
Type the smallest and largest value for each axis and the graph paper arranges itself: the origin lands wherever zero falls, and the squares stay perfectly square, so the shape of the sheet follows from your ranges.
Choose how often the axes are numbered, then how many small squares sit between the numbers to make the grid finer or coarser. Leave the steps on auto and a sensible scale is chosen for you.
The x-axis can count in ordinary numbers, in degrees or in multiples of π, which makes trigonometric graphs quick to set up. For bar charts, tick the box to put the numbers in the gaps, or type your own category names.
When a range does not include zero, for example years from 1990 to 2030, the axis runs along the edge of the grid and a small zig-zag shows that the scale has been broken.
Press Present full screen and write over the grid with the pen tools of your interactive display, or project it onto an ordinary whiteboard and write on that. That is the idea behind the whole Shine+Write collection: shine the image, then write on it. Choose the XL lettering so the numbers can be read from the back row, and try the chalkboard or blueprint paper for something different.
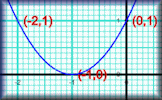
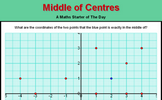
Switch on Plot points to drop labelled points on the grid. Join them up and you have a shape ready to reflect, rotate, translate or enlarge.
For other visual aids see Shine+Write.
Copy image puts a high-resolution picture on the clipboard, ready to paste into Word, Google Docs, PowerPoint, Slides or OneNote. Download SVG gives a drawing that stays sharp at any size.
Print on A4 sizes the grid to fill the page, so there is no need to fiddle with scaling. Print 1, 2, 4 or 6 grids on a sheet and add Name and Date lines to make quick worksheets that can be cut up and handed out. With dark paper, turn on Background graphics in the print dialogue.
Every setting is stored in the page address and remembered by this browser. Copy link and paste it into Google Classroom, Teams or your lesson plan and the same graph paper opens, points and all.
Many other visual aids for the Maths teacher are available on this website, along with an ever increasing number of interactive exercises for students. Browse the collection from the menu at Transum Mathematics.
|
|

|
|
|
|
|
|
|
|
|
|
|
|
|
|
|
“I never trust people with graph paper. I always think they are plotting something!”
Do you have any comments? It is always useful to receive feedback and helps make this free resource even more useful for those learning Mathematics anywhere in the world. Click here to enter your comments.
Have a look at the Graphs topics page for many more related activities.