
|
|
Exam-Style Questions.Problems adapted from questions set for previous Mathematics exams. |
1. | GCSE Higher [254] |
The graph shows the height of water in a container over a period time during which the water enters the container at a constant rate.
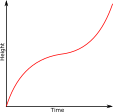
Which of the following might be a diagram of the container?
a.  b.
b.  c.
c.  d.
d.  e.
e. 
2. | GCSE Higher [255] |
The diagram is of a container which is filled with water entering at a constant rate.
Which of the following might be the graph of height of the water in the container plotted against time?
a. 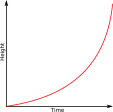 b.
b. 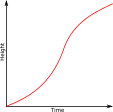 c.
d.
c.
d. 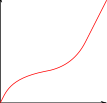 e.
e. 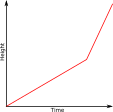
3. | GCSE Higher [189] |
The following diagram shows a distance-time graph of the movement of a fish.
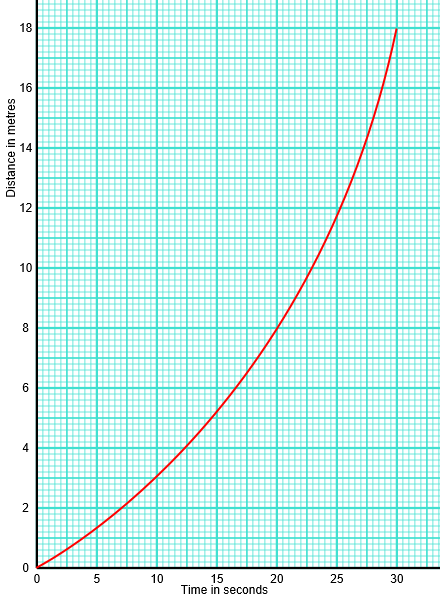
(a) Work out the average speed between 10 and 20 seconds.
(b) Estimate the speed of the fish at 25 seconds.
4. | GCSE Higher [171] |
A model train is placed on a length of straight track.
(a) Draw a velocity-time graph for the train on graph paper provided below.
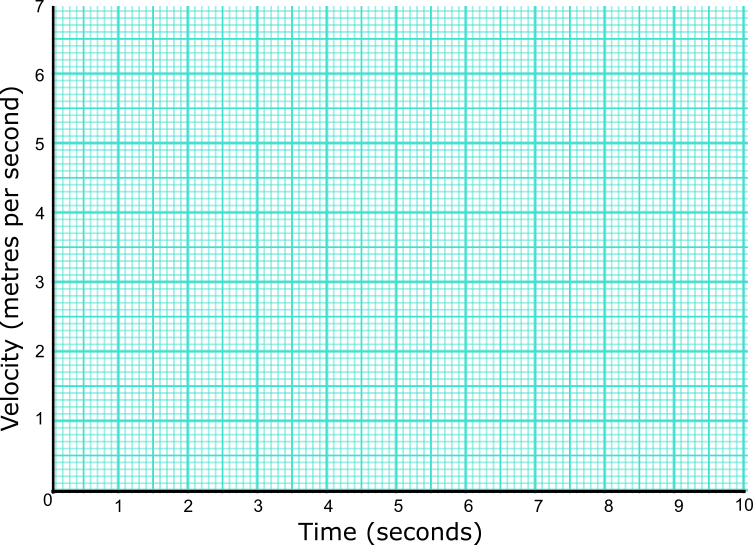
(b) Work out the total distance travelled by the model train.
5. | GCSE Higher [522] |
A motorbike moves from rest along a straight road. The graph below shows the speed, \(v\) in metres per second of the motorbike \(t\) seconds after it started to move.
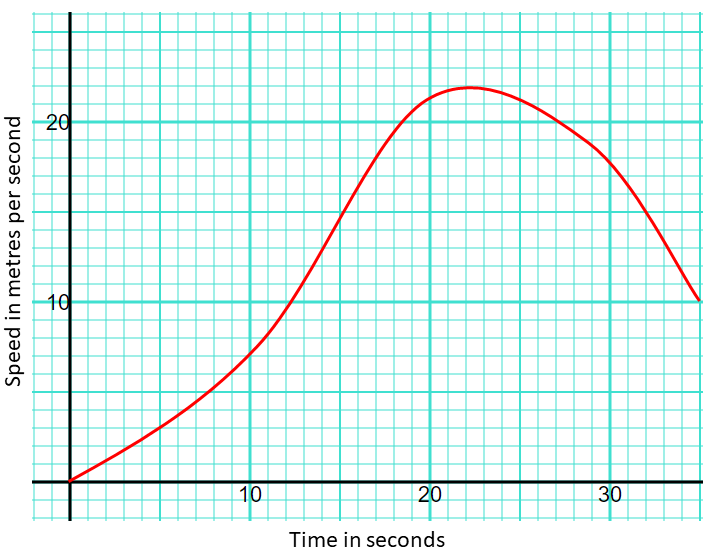
(a) What is the maximum speed achieved by the motorbike.
(b) Calculate an estimate of the gradient of the graph at t = 10.
(c) Describe what your answer to part (b) represents.
(d) Work out an estimate for the distance the motorbike travels in the first 25 seconds of its journey by dividing the area under the graph into five strips of equal width.
6. | GCSE Higher [367] |
The graph shows the temperature (\(T\)) of an unidentified flying object over a period of 10 seconds (\(t\)).
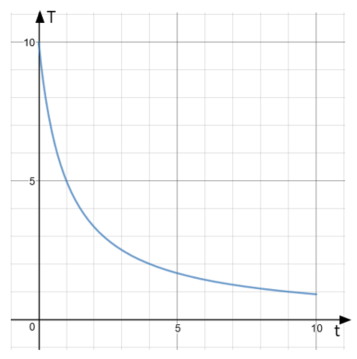
Use the graph to work out an estimate of the rate of decrease of temperature at 7 seconds. You must show your working.
7. | GCSE Higher [480] |
The graph shows the distance travelled, in metres, of a commuter train as it pulls out of a station.
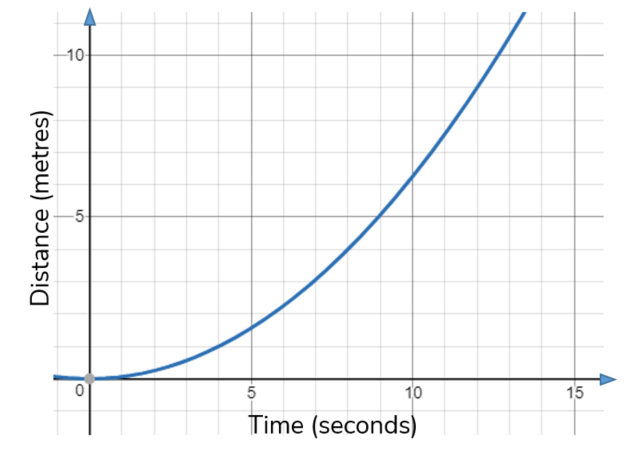
Estimate the speed of the train, in m/s, after 10 seconds. You must show your working.
8. | GCSE Higher [239] |
Here is a speed-time graph for a go kart.
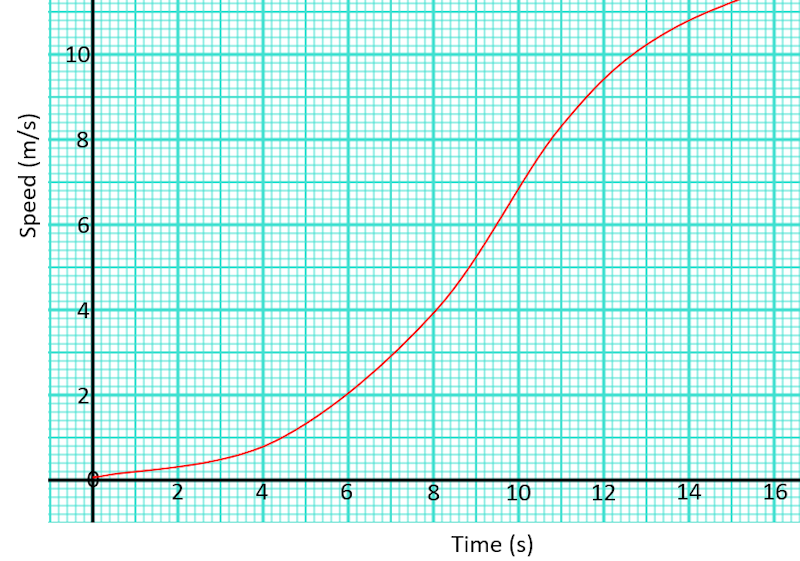
Work out an estimate for the distance the kart travelled in the first 12 seconds by using six strips of equal width.
If you would like space on the right of the question to write out the solution try this Thinning Feature. It will collapse the text into the left half of your screen but large diagrams will remain unchanged.
The exam-style questions appearing on this site are based on those set in previous examinations (or sample assessment papers for future examinations) by the major examination boards. The wording, diagrams and figures used in these questions have been changed from the originals so that students can have fresh, relevant problem solving practice even if they have previously worked through the related exam paper.
The solutions to the questions on this website are only available to those who have a Transum Subscription.
Exam-Style Questions Main Page
To search the entire Transum website use the search box in the grey area below.
Do you have any comments about these exam-style questions? It is always useful to receive feedback and helps make this free resource even more useful for those learning Mathematics anywhere in the world. Click here to enter your comments.

