
|
|
Pie ChartsDevelop the skills to construct and interpret pie charts in this self-marking set of exercises. |
Here are the clues that will help you label the pie charts about the pupils in Piechart School.
One third of the pupils preferred oranges while only one quarter of the pupils preferred apples. Twice as many pupils preferred oranges than bananas. The number of pupils that preferred grapes was four times as many as preferred mangoes.
Half of the pupils walk to school but less than three percent travel in a taxi. For every pupil that comes to school by car there are four that walk.
This is Pie Charts level 1. You can also try:
Level 2
Level 3
Level 4
Level 5
InstructionsTry your best to answer the questions above. Type your answers into the boxes provided leaving no spaces. As you work through the exercise regularly click the "check" button. If you have any wrong answers, do your best to do corrections but if there is anything you don't understand, please ask your teacher for help. When you have got all of the questions correct you may want to print out this page and paste it into your exercise book. If you keep your work in an ePortfolio you could take a screen shot of your answers and paste that into your Maths file. |
||
|
|
||

|
More Activities: |
|
|
Mathematicians are not the people who find Maths easy; they are the people who enjoy how mystifying, puzzling and hard it is. Are you a mathematician? Comment recorded on the 21 October 'Starter of the Day' page by Mr Trainor And His P7 Class(All Girls), Mercy Primary School, Belfast: "My Primary 7 class in Mercy Primary school, Belfast, look forward to your mental maths starters every morning. The variety of material is interesting and exciting and always engages the teacher and pupils. Keep them coming please." Comment recorded on the 16 March 'Starter of the Day' page by Mrs A Milton, Ysgol Ardudwy: "I have used your starters for 3 years now and would not have a lesson without one! Fantastic way to engage the pupils at the start of a lesson." |
Each month a newsletter is published containing details of the new additions to the Transum website and a new puzzle of the month. The newsletter is then duplicated as a podcast which is available on the major delivery networks. You can listen to the podcast while you are commuting, exercising or relaxing. Transum breaking news is available on Twitter @Transum and if that's not enough there is also a Transum Facebook page. |
|
Featured ActivityShunting Puzzles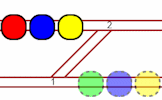 These puzzles are Transum's versions of the shunting or switching puzzles made popular by train enthusiasts and logic puzzle solvers. |
AnswersThere are answers to this exercise but they are available in this space to teachers, tutors and parents who have logged in to their Transum subscription on this computer. A Transum subscription unlocks the answers to the online exercises, quizzes and puzzles. It also provides the teacher with access to quality external links on each of the Transum Topic pages and the facility to add to the collection themselves. Subscribers can manage class lists, lesson plans and assessment data in the Class Admin application and have access to reports of the Transum Trophies earned by class members. If you would like to enjoy ad-free access to the thousands of Transum resources, receive our monthly newsletter, unlock the printable worksheets and see our Maths Lesson Finishers then sign up for a subscription now: Subscribe |
|
Go MathsLearning and understanding Mathematics, at every level, requires learner engagement. Mathematics is not a spectator sport. Sometimes traditional teaching fails to actively involve students. One way to address the problem is through the use of interactive activities and this web site provides many of those. The Go Maths page is an alphabetical list of free activities designed for students in Secondary/High school. Maths MapAre you looking for something specific? An exercise to supplement the topic you are studying at school at the moment perhaps. Navigate using our Maths Map to find exercises, puzzles and Maths lesson starters grouped by topic. | ||
Teachers | ||
|
If you found this activity useful don't forget to record it in your scheme of work or learning management system. The short URL, ready to be copied and pasted, is as follows: |
Alternatively, if you use Google Classroom, all you have to do is click on the green icon below in order to add this activity to one of your classes. |
It may be worth remembering that if Transum.org should go offline for whatever reason, there is a mirror site at Transum.info that contains most of the resources that are available here on Transum.org. When planning to use technology in your lesson always have a plan B! |
|
Do you have any comments? It is always useful to receive feedback and helps make this free resource even more useful for those learning Mathematics anywhere in the world. Click here to enter your comments. |
||
© Transum Mathematics 1997-2024
Scan the QR code below to visit the online version of this activity.
https://www.Transum.org/go/?Num=233
Close

Level 1 - Label the diagram showing two pie charts
Level 2 - Estimating what quantities the sectors of pie charts represent
Level 3 - Measuring the angles in the sectors and calculating what they represent
Level 4 - Drawing pie charts from the given data
Level 5 - Problem solving tasks involving pie charts
Pie Chart Creator - A quick and convenient tool for rapidly creating simple pie charts.
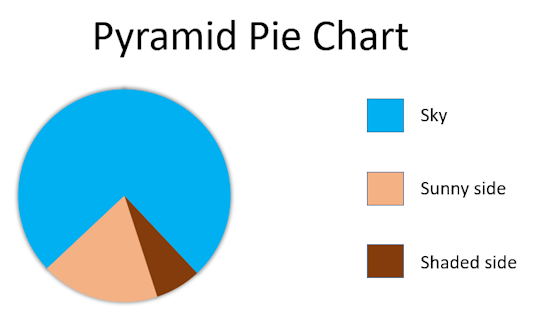
Pie Chart Starter - The Starter Of The Day for June 10th is a pie chart from which pupils are invited to estimate what each sector stands for.
More on this topic including lesson Starters, visual aids and investigations.
Answers to this exercise are available lower down this page when you are logged in to your Transum account. If you don’t yet have a Transum subscription one can be very quickly set up if you are a teacher, tutor or parent.
See the National Curriculum page for links to related online activities and resources.
The video above is from the YouTube channel called 'Mathscasts'
Don't wait until you have finished the exercise before you click on the 'Check' button. Click it often as you work through the questions to see if you are answering them correctly. You can double-click the 'Check' button to make it float at the bottom of your screen.
Answers to this exercise are available lower down this page when you are logged in to your Transum account. If you don’t yet have a Transum subscription one can be very quickly set up if you are a teacher, tutor or parent.
Close


Unknown Source,
Sunday, July 7, 2019
" "
"