Name ............................................

TablesMaster

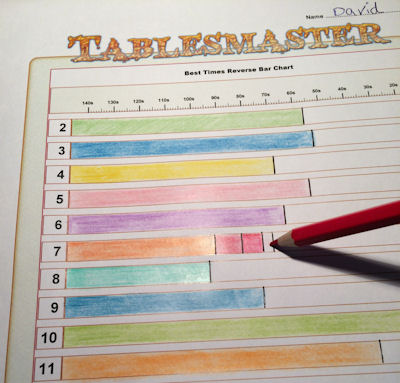
 Priscillaallan's Best Times Reverse Bar Chart
20s
30s
40s
50s
60s
70s
80s
90s
100s
110s
120s
130s
140s

2

3

4

5

6

7

8

9

10

11

12

Notes and targets:

© Transum Mathematics 1997 - 2024

This reverse bar chart shows your personal best times for answering times tables questions.

The longer the bar, the less time it took to complete the twenty questions on Tablesmaster. Use this record of your progress to identify your weaker times tables and spend time improving them.

More Times Table practice activities can be found on our Times Tables page.

Tablesmaster Personal Best

Above you can see a pupil's progress recorded on a printable version of this reverse bar chart grid. You can see that the pupil is currently working on his seven times table and as he gets faster at answering the questions the bar gets longer to show the progress made.

 Average time taken by all the people who have ever attempted Tablesmaster:
20s
30s
40s
50s
60s
70s
80s
90s
100s
110s
120s
130s
140s

2

3

4

5

6

7

8

9

10

11

12

Apple

©1997-2024 WWW.TRANSUM.ORG