Here are some specific activities, investigations or visual aids we have picked out. Click anywhere in the grey area to access the resource.
 Pascal's Triangle Get to know this famous number pattern with some revealing learning activities
 Plinko Probability A simulation of a Quincunx (Galton Board) which can be used to create the bell shaped curve of the normal distribution.
Here are some exam-style questions on this statement:
- "Mr Willis goes to school (he's a Maths teacher) five times each week during term time. On any given day, the probability that he goes on an orange bus is \( \frac13 \)." ... more
- "A small digital storage manufacturer makes novelty USB drives which are given away at conferences. The probability that a drive is defective is 0.03. The factory tests a random sample of 200 drives." ... more
- "The probability of winning a gold coin in a game of chance is 0.6. The game is played six times. Find the probability of winning:" ... more
- "A factory manufactures switches. It is known that the probability that a switch is found to be defective is 0.04. A random sample of 50 switches is tested." ... more
- "A famous pole vaulter finds that she is successful on 85% of her attempts at clearing five metres. Her Wikipedia entry confirms that her success rate is 85%." ... more
- "The travelling times by train, \( T \) minutes, between two towns can be modelled by a normal distribution with a mean of 55 minutes and a standard deviation of \( \sigma \) minutes." ... more
- "Bostock and Chandler play one game of Ultimate Noughts and Crosses online each day they are in quarantine." ... more
- "At the south end of Playfair Amusement park are two games of chance, Beat The Goalie and Basketball Bounce." ... more
- "The length of Costlow's bâtard bread loaves in centimetres is normally distributed with mean \( \mu \). The following table shows probabilities for values of \(L\)." ... more
Click on a topic below for suggested lesson Starters, resources and activities from Transum.
Furthermore
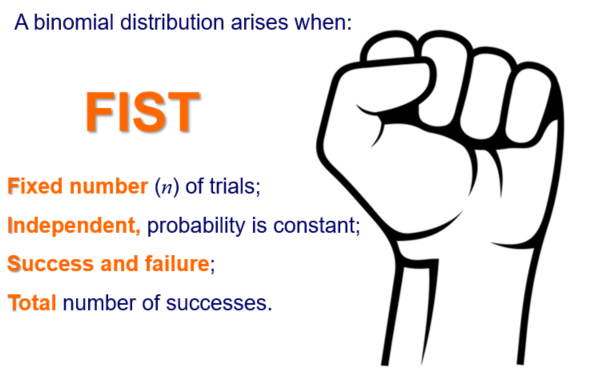
The binomial distribution is a probability distribution that summarises the likelihood that a value will take one of two independent values under a given set of parameters or assumptions. Specifically, it models the number of successes in a fixed number of trials where each trial has the same probability of success. The mean (or expected value) and variance are key characteristics of this distribution.
The mean of a binomial distribution is given by the formula \( \mu = n \times p \), where \( n \) is the number of trials and \( p \) is the probability of success in each trial. The variance is given by the formula \( \sigma^2 = n \times p \times (1-p) \). These values help to understand the distribution's central tendency and the spread of the probability across the number of successes.
Key formulae for the binomial distribution:
- Mean: \( \mu = n \times p \)
- Variance: \( \sigma^2 = n \times p \times (1-p) \)
Example:
Consider a scenario where a student answers 10 true/false questions and guesses each answer. Assuming the probability of guessing correctly is 0.5, the mean and variance of the number of correct answers can be calculated as:
Mean: \( \mu = n \times p = 10 \times 0.5 = 5 \)
Variance: \( \sigma^2 = n \times p \times (1-p) = 10 \times 0.5 \times (1-0.5) = 2.5 \)
Thus, the student can expect, on average, to guess correctly 5 out of 10 times, with a variance of 2.5 in the number of correct guesses.
Note: In examinations, students should use technology to find binomial probabilities, as the formal proof of mean and variance is not required.

If you use a TI-Nspire GDC there are instructions useful for this topic.
This Binomial Distribution Video is from Revision Village and is aimed at students taking the IB Maths Standard level course.
This Bicen Maths video clip shows everything you need to memorise on this topic for A Level Statistics.
How do you teach this topic? Do you have any tips or suggestions for other teachers? It is always useful to receive feedback and helps make these free resources even more useful for Maths teachers anywhere in the world. Click here to enter your comments.

