Here are some specific activities, investigations or visual aids we have picked out. Click anywhere in the grey area to access the resource.
 Plotting Graphs Complete a table of values then plot the corresponding points to create a graph.
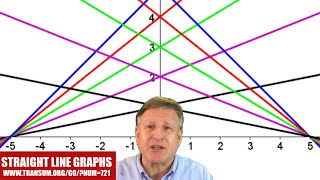 Straight Line Graphs Video After drawing a straight line graph learn about its equation in the form y = mx + c.
 Straight Line Graph Equation An online exercise about the equation y=mx+c and the features of a straight line graph.
 Don's Graph Snaps Complete the tables and find the equations of the graphs that can be seen in the snaps.
 Graph Equation Pairs Match the equation with its graph. Includes quadratics, cubics, reciprocals, exponential and the sine function.
 Graph Patterns Find the equations which will produce the given patterns of graphs.
 Line Graph Challenge A challenge to produce the straight line patterns using a GDC or graph plotting software.
 Straight Line Graphs 10 straight line graph challenges for use with computer graph plotting software or a graphical display calculator.
 Graph Match Match the equations with the images of the corresponding graphs. A drag-and-drop activity.
Here are some exam-style questions on this statement:
- "The images below show a graphic display calculator screen with different functions displayed as graphs." ... more
- "Match the equation with the letter of its graph" ... more
- "The graph of y = f(x) is drawn accurately on the grid." ... more
- "Part of the function of \(y=f(x)\) is shown in the following diagram." ... more
- "A function is defined as \(f(x) = 2{(x - 3)^2} - 5\) ." ... more
- "Let \(f(x) = \frac{9x-3}{bx+9}\) for \(x \neq -\frac9b, b \neq 0\)." ... more
Here are some Advanced Starters on this statement:
- GDC Challenge
Produce the given graph on a graphic display calculator more - Venn Graphs
Type the equation of a graph into each section of the Venn diagram. more
Click on a topic below for suggested lesson Starters, resources and activities from Transum.
- Functions A relationship between two sets can be called a mapping. Elements of the first set (domain) are mapped to elements of the second set (range). A function is a special type of mapping for which one value in the domain maps to one, and only one value in the range.Pupils in Primary school will use the concept of function machines to perform calculations. They will then learn to ‘work backwards’ to find the inverse function. The study of functions becomes more formal as pupils become more proficient and able to cope with more complex mathematical ideas.
- Graphs This topic includes algebraic and statistical graphs including bar charts, line graphs, scatter graphs and pie charts. A graph is a diagram which represents a relationship between two or more sets of numbers or categories. The data items are shown as points positioned relative to axes indicating their values. Pupils are typically first introduced to simple bar charts and learn to interpret their meaning and to draw their own. More sophisticated statistical graphs are introduced as the pupil's mathematical understanding develops. Pupils also learn about coordinates as a pre-requisite for understanding algebraic graphs. They then progress to straight line graphs before learning to work with curves, gradients, intercepts, regions and, for older pupils, calculus.
Furthermore
The graph of a function is a fundamental concept in mathematics, representing the relationship between two quantities. The graph is typically drawn in a coordinate system where the independent variable \( x \) is plotted along the horizontal axis and the dependent variable \( y \) along the vertical axis. The equation of a graph is given as \( y = f(x) \), where \( f(x) \) is a function that provides the value of \( y \) for each value of \( x \).
Sketching a graph involves creating a visual representation of the function based on given information or a specific context. This may include transferring a graph from a digital display to paper. It's important to differentiate between 'drawing' and 'sketching' a graph. While drawing requires precision and often involves plotting specific points, sketching is about representing the general shape and key features of the graph.
When sketching graphs, certain key features should be identified and labelled. These include:
- The intercepts with the axes. The \( x \)-intercept(s) where the graph crosses the \( x \)-axis (\( f(x) = 0 \)) and the \( y \)-intercept where it crosses the \( y \)-axis (\( x = 0 \)).
- Turning points, where the graph changes direction, indicating local maxima and minima.
- Points of inflection, where the curvature of the graph changes.
- Asymptotic behaviour, where the graph approaches a line or curve without ever touching it.
- End behaviour, describing how the graph behaves as \( x \) approaches infinity or negative infinity.
Technology plays a crucial role in graphing functions. It allows for the exploration of the behaviour of functions, including their sums and differences. Graphing calculators or software can provide a visual representation, which can then be analysed and sketched. When using technology, it's essential to understand the limitations and ensure that key features of the graph are accurately represented in the sketch.
In summary, graph sketching is a skill that requires understanding the behaviour of functions and their graphical representations. It's not just about creating a visual representation but also about interpreting and understanding the function's characteristics. Remember to label all axes and key features in your sketches to provide a clear and informative graph.
How do you teach this topic? Do you have any tips or suggestions for other teachers? It is always useful to receive feedback and helps make these free resources even more useful for Maths teachers anywhere in the world. Click here to enter your comments.

