
|
|
Exam-Style Questions on StatisticsProblems on Statistics adapted from questions set in previous Mathematics exams. |
1. | GCSE Higher |
Ben measured the length and the width of each of 10 sea shells of the same type. The results are shown below.
(a) Construct a scatter graph with this data.
| Sea Shell Dimensions | |
| Length(cm) | Width(cm) |
| 7.3 | 2.7 |
| 9.7 | 3.2 |
| 7.5 | 2.6 |
| 6.1 | 2.9 |
| 9.0 | 2.9 |
| 8.7 | 3.0 |
| 7.5 | 2.5 |
| 10.3 | 3.5 |
| 9.5 | 3.3 |
The point representing the results for one of the shells is an outlier.
(b) Explain how the results for this shell differ from the results for the other shells.
2. | GCSE Higher |
A survey is carried out by asking people questions as they come out of a coffee bar.
A section of the questionnaire is shown below.
Put a tick ☑ into the box in front of your chosen answer.
1. How often do you visit a coffee bar?
☐ Every day; ☐ Once or twice each week; ☐ Never.
2. What is your gender?
☐ Female; ☐ Male.
3. What is your age group?
☐ Under 10; ☐ 10-20; ☐ 20-30; ☐ 31-40.
(a) Explain why this is a biased survey.
(b) State two criticisms of the questions or the options given for answers.
3. | GCSE Higher |
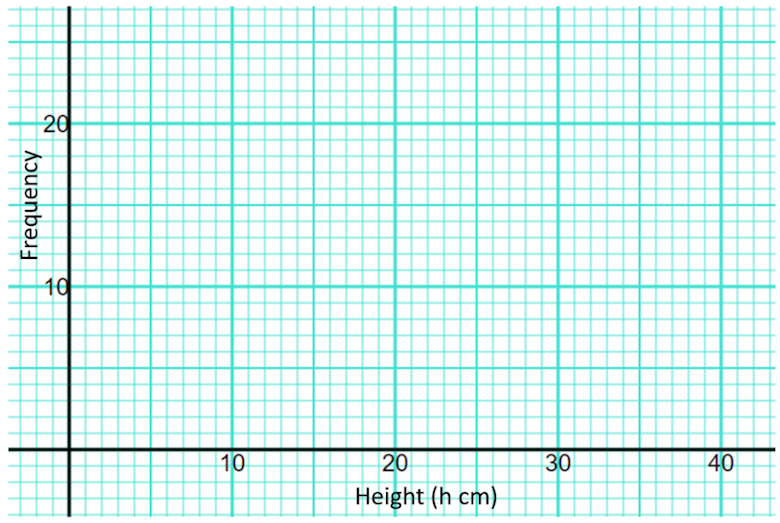
The table shows information about the heights of 85 stalagmites.
| Height (\(h\) cm) | Frequency |
|---|---|
| \(10\lt h \le 15\) | 9 |
| \(15\lt h \le 20\) | 13 |
| \(20\lt h \le 25\) | 18 |
| \(25\lt h \le 30\) | 22 |
| \(30\lt h \le 35\) | 15 |
| \(35\lt h \le 40\) | 8 |
(a) Find the class interval that contains the median.
(b) On the grid below, draw a frequency polygon for the information in the table.
4. | IGCSE Extended |
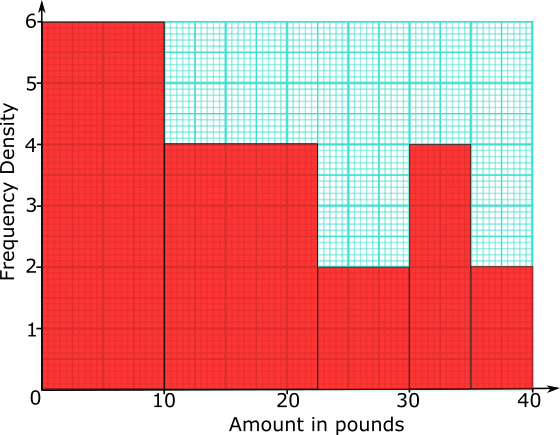
155 people were asked how much money they would pay for particular three-course meal in a special restaurant.
The histogram shows the results of the survey.
(a) Complete the frequency table for information shown in the histogram.
| Amount (£\(x\)) | \(0\lt x \le 10\) | ||||
|---|---|---|---|---|---|
| Frequency | 20 |
(b) Use your frequency table to calculate an estimate of the mean amount these people would pay for the meal.
5. | GCSE Higher |
Jimmy is ordering the t-shirts for the community choir which has 240 members.
He asks a sample of 36 members what colour the t-shirts should be. Each members chooses one colour.
The table shows information about his results.
| Colour | Number of members |
|---|---|
| Blue | 6 |
| Red | 3 |
| Green | 7 |
| Yellow | 5 |
| Purple | 2 |
| Black | 6 |
| White | 7 |
(a) Work out how many of the 240 members you think will want black t-shirts.
(b) State any assumption you made and explain how this may affect your answer.
6. | GCSE Higher |
The scatter graph gives information about the marks earned in a Statistic exam and a Mathematics exam by each of 13 students.
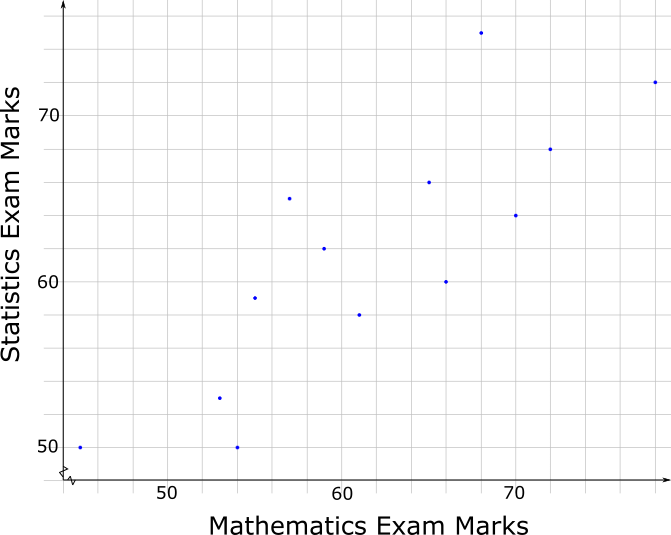
The box plot for the Mathematics exam for the 13 students is drawn on the grid below.
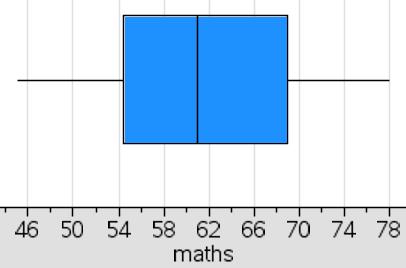
(a) Draw the box plot for the Statistics exam.
(b) Compare the distributions of marks scored in the two exams.
7. | GCSE Higher |
The table shows the marks earned by 200 students taking a Maths exam.
| Mark (n) | \(0\lt n \le 10\) | \(10\lt n \le 20\) | \(20\lt n \le 30\) | \(30\lt n \le 40\) | \(40\lt n \le 50\) | \(50\lt n \le 60\) | \(60\lt n \le 70\) | \(70\lt n \le 80\) |
| Frequency | 3 | 7 | 33 | 42 | 54 | 35 | 20 | 6 |
(a) Use the data in the table above to complete the following cumulative frequency table
| Mark (n) | \(n \le 10\) | \(n \le 20\) | \(n \le 30\) | \(n \le 40\) | \(n \le 50\) | \(n \le 60\) | \(n \le 70\) | \(n \le 80\) |
| Cumulative Frequency | 200 |
(b) Draw the cumulative frequency curve on graph paper.
The top 5% of students will receive an A grade. The next 15% of students will receive a B grade and the next 30% will receive a C grade.
(c) Use your graph to estimate the lowest mark that B grade will be awarded for.
8. | GCSE Higher |
The table shows the amount of time, in months, taken to sell houses on the Happyland housing estate.
| Time (m months) | Frequency |
| 0 < m ≤ 2 | 10 |
| 2 < m ≤ 5 | 21 |
| 5 < m ≤ 10 | 25 |
| 10 < m ≤ 15 | 20 |
| 15 < m ≤ 20 | 25 |
(a) Draw a histogram for the information in the table.
(b) Find an estimate for the median.
9. | IB Studies |
The following grouped frequency table shows the length of time, \(t\), in minutes, visitors watched an octopus swimming around a tank at an aquarium.
| Time (\(t\)) | Visitors |
|---|---|
| \(0\lt t \le 5\) | 23 |
| \(5\lt t \le 10\) | 13 |
| \(10\lt t \le 15\) | 9 |
| \(15\lt t \le 20\) | 6 |
| \(20\lt t \le 25\) | 2 |
| \(25\lt t \le 30\) | 1 |
(a) Write down the total number of visitors who were included in the survey.
(b) Write down the mid-interval value for the \(20\lt t \le 25\) group.
(c) Find an estimate of the mean time visitors took watching the octopus.
The information above has been rewritten as a cumulative frequency table.
| Time (\(t\)) | \(t \le 5\) | \(t \le 10\) | \(t \le 15\) | \(t \le 20\) | \(t \le 25\) | \(t \le 30\) |
|---|---|---|---|---|---|---|
| Cumulative frequency | 23 | 36 | \(a\) | 51 | 53 | \(b\) |
(d) Write down the values of \(a\) and \(b\).
This information is shown in the following cumulative frequency graph.
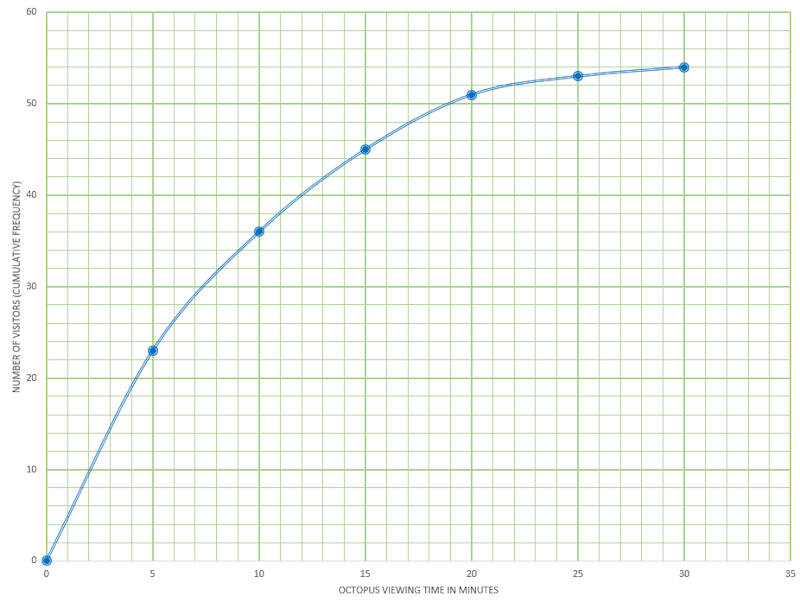
(e) Use the graph to estimate the maximum time taken watching the octopus for the first 32 visitors (arranged in order of increasing viewing time).
(f) Use the graph to estimate the number of visitors who spent less than 13 minutes watching the octopus.
(g) Use the graph to estimate the number of visitors who take more than 17 minutes watching the octopus.
10. | GCSE Higher |
The charts below show the results of pupils in a Year Group answering twenty mental arithmetic questions.
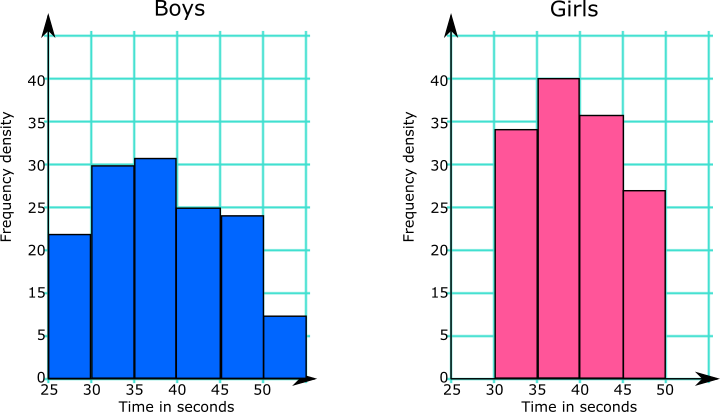
What information from the diagrams can be used to support or counter each of these statements?
(a) Girls are better at mental arithmetic than boys.
(b) The range of the boys' times is greater than the range of the girls' times.
The Head of the school would like to use this data to make statements about all of the pupils in the school.
(c) Comment on whether any conclusions can be drawn for the whole school population from the results of this Year Group.
11. | GCSE Higher |
The following table shows the number of times people in a sample group visited the cinema in a six month period.
One of the frequencies is missing.
| Cinema Visits | Frequency | Midpoint | |
|---|---|---|---|
| 0-4 | 20 | 2 | |
| 5-9 | 24 | 7 | |
| 10-14 | 12 | ||
| 15-19 | 7 | 17 |
Midpoints are used to work out an estimate for the mean number of visits.
The mean is calculated to be 7.25.
Work out the missing frequency.
12. | IB Analysis and Approaches |
The following table contains data collected from an experiment.
| \(x\) | 1.6 | 2.3 | 3.4 | 4.7 | 5.5 | 6.5 | 7.8 |
| \(y\) | 2.7 | 2.9 | 3.5 | 3.6 | 4.0 | 4.3 | 4.5 |
(a) Plot points representing this data on the coordinate grid below.
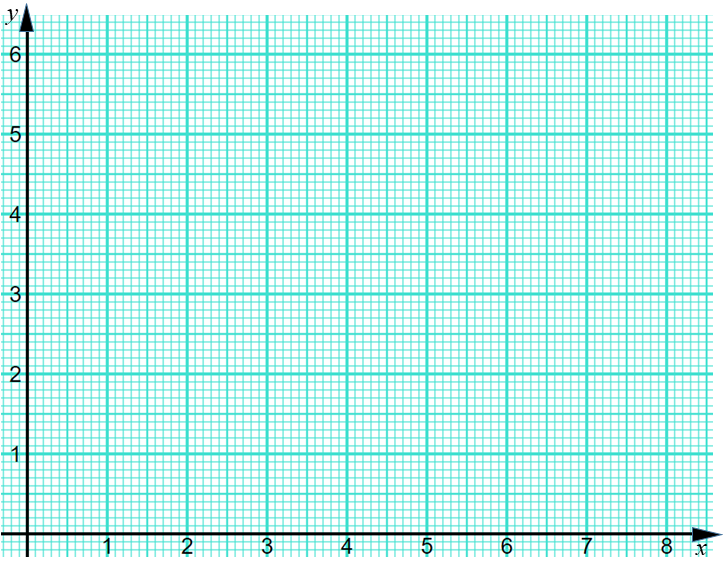
(b) Find the equation of the regression line of \(y\) on \(x\) and draw the graph of that line on the scatter graph you have created.
(c) Use your equation to predict the value of \(y\) when \(x=5\).
(d) Write down the value of the Pearson’s product-moment correlation coefficient, \(r\).
13. | IB Standard |
The following table shows the number of days families spend in a particular seaside hotel in August last year.
| Days | Frequency | Cumulative frequency |
|---|---|---|
| 2 | 3 | 3 |
| 5 | 11 | 14 |
| 7 | 15 | 29 |
| 10 | \(x\) | 39 |
| 14 | 5 | 44 |
(a) Find the value of \(x\).
(b) Find the mean.
(c) Find the variance.
14. | IB Analysis and Approaches |
Miss Chloe Sharpe (singing teacher) was teaching nine students last year. At the end of the year the students took a singing exam and their results were reported as percentages. Chloe decided to record the average number of hours per week each student reported practising in the weeks before the examination.
These results can be seen in the table below.
| Average weekly practice time (\(p\)) | 25 | 30 | 23 | 28 | 34 | 27 | 36 | 19 | 28 |
|---|---|---|---|---|---|---|---|---|---|
| Percentage score (\(s\)) | 70 | 89 | 64 | 88 | 97 | 81 | 95 | 70 | 85 |
(a) Find Pearson's product-moment correlation coefficient, \(r\), for these data.
(b) The relationship between the variables can be modelled by the regression equation \(s = ap + b\). Write down the value of \(a\) and the value of \(b\).
(c) One of these nine students was disappointed with his result and wished he had practised more. Based on the given data, determine how his score could have been expected to alter had he practised an extra four hours per week.
15. | IB Analysis and Approaches |
Data is collected about size in square metres of apartments in a city and the monthly cost of renting them. The size of the apartments is shown in this box and whisker diagram.
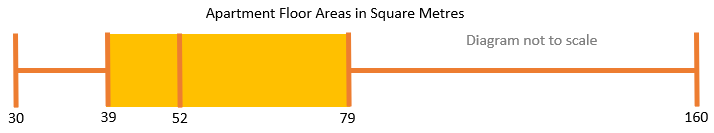
(a) Find the largest apartment area that would not be considered an outlier.
The areas in square metres and costs in pounds, denoted by a and c respectively, are plotted as a scatter graph.
The regression line of c on a is \(c = 5a + 130\). The regression line of a on c is \(a=\dfrac{c}{8}+10\).
(b) One of the apartments in the data set costs £680 per month to rent. Estimate the area of that apartment.
(c) Find the mean monthly rental cost of all the apartments in the data set.
16. | IB Studies |
The times taken in seconds by a group of students to complete an online exercise are listed as follows.
$$31, 34, 41, 33, 29, 31, 39, 35, 30, 40.$$(a) Find the median time.
(b) Calculate the interquartile range.
(c) Find the probability that a student chosen at random from the group took at least 35 seconds to completed the exercise.
17. | IB Standard |
The personal trainer collected data from a randomly selected sample of days. From this he found that the number glasses of water he drank in a day had a mean of 4.35.
| Glasses | 1 | 2 | 3 | 4 | 5 | 6 | 7 |
|---|---|---|---|---|---|---|---|
| Frequency | 3 | 5 | 5 | 8 | \(x\) | 7 | 6 |
(a) Find the number of days represented by \(x\)
(b) Write down the standard deviation.
18. | IB Analysis and Approaches |
A TV company surveyed 88 of its employees to find out how much time they spend travelling to work on a given day. The results of the survey are shown in the following cumulative frequency diagram.
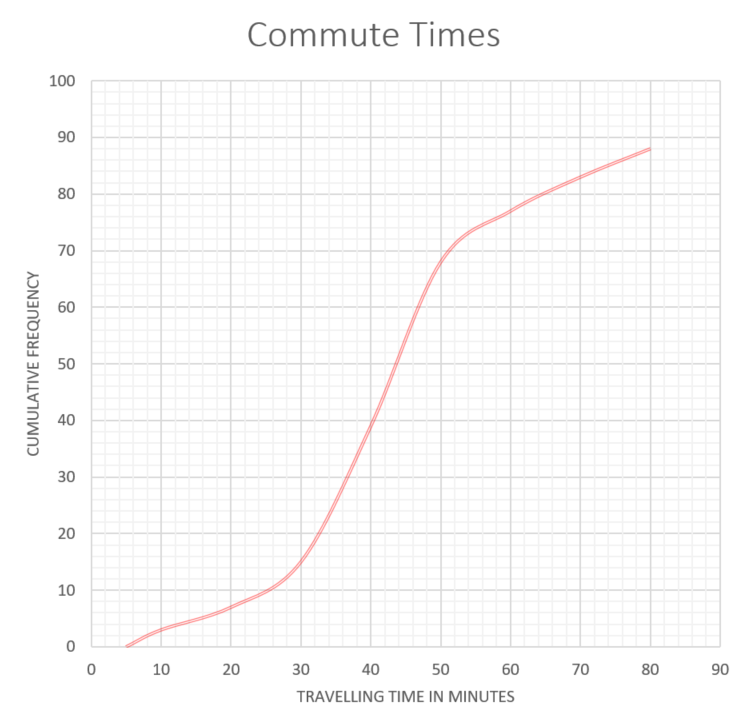
(a) Find the median number of minutes spent travelling to work.
(b) Find the interquartile range.
(c) Find the number of employees whose travelling time is within 20 minutes of the median.
(d) Only 10% of the employees spent less than k minutes travelling to work. Find the value of k.
The results of the survey can also be displayed on the following box-and-whisker diagram.
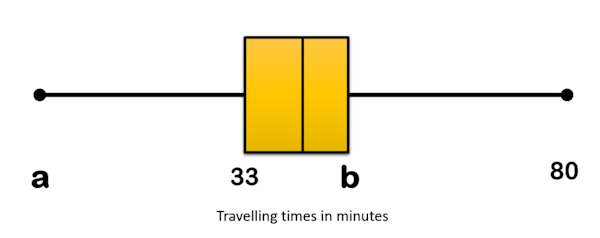
(e) Write down the value of a.
(f) Find the value of b.
(g) Travelling times of less than p minutes are considered outliers. Find the value of p .
19. | IB Studies |
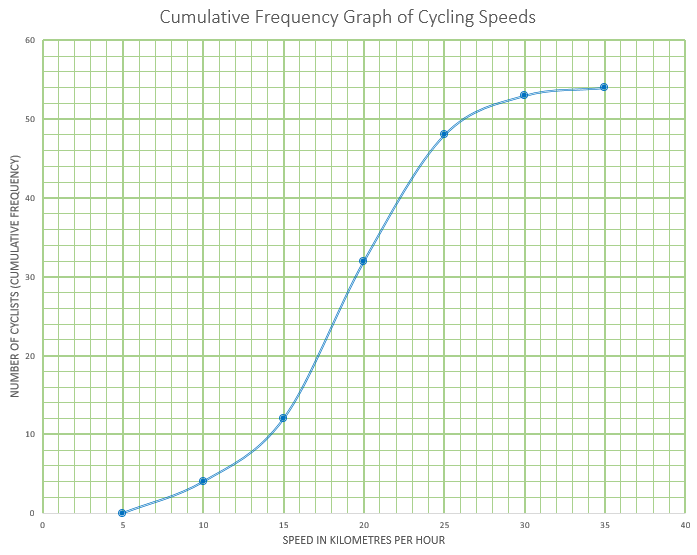
This cumulative frequency graph shows the speeds in kmh-1 of cyclists passing a certain point on a race track.
(a) Estimate the minimum possible speed of one of these cyclists.
(b) Find the median speed of the cyclists.
(c) Write down the 65th percentile.
(d) Calculate the interquartile range.
(e) Find the number of these cyclists that were travelling faster than 22 kmh-1
The table shows the speeds of these cyclists.
| Speed of Cyclists (s) | Number of Cyclists |
|---|---|
| \(0 \lt s \le 5\) | 0 |
| \(5 \lt s \le 10\) | \(a\) |
| \(10 \lt s \le 15\) | 8 |
| \(15 \lt s \le 20\) | 20 |
| \(20 \lt s \le 25\) | 16 |
| \(25 \lt s \le 30\) | 5 |
| \(30 \lt s \le 35\) | \(b\) |
(f) Find the value of \(a\) and of \(b\)
(g) Write down the modal class.
(h) Write down the mid-interval value for the modal class.
(i) Use your graphic display calculator to calculate an estimate of the mean speed of these cyclists.
(j) Use your graphic display calculator to calculate an estimate of the standard deviation of the speeds of these cyclists.
20. | IB Standard |
A data set has \(n\) items. The sum of the items is 650, the mean is 13 and the standard deviation is 5.
(a) Find n.
If each value in the set is multiplied by 7:
(b) Write down the value of the new mean;
(c) Find the value of the new variance.
If you would like space on the right of the question to write out the solution try this Thinning Feature. It will collapse the text into the left half of your screen but large diagrams will remain unchanged.
The exam-style questions appearing on this site are based on those set in previous examinations (or sample assessment papers for future examinations) by the major examination boards. The wording, diagrams and figures used in these questions have been changed from the originals so that students can have fresh, relevant problem solving practice even if they have previously worked through the related exam paper.
The solutions to the questions on this website are only available to those who have a Transum Subscription.
Exam-Style Questions Main Page
To search the entire Transum website use the search box in the grey area below.
Do you have any comments about these exam-style questions? It is always useful to receive feedback and helps make this free resource even more useful for those learning Mathematics anywhere in the world. Click here to enter your comments.

